Bollinger Bands Crossover Study
By Samantha Baltodano
TL;DR:
Bollinger bands crossover shows the points in which price moves outside of bollinger bands. Price movement outside of bollinger bands is highly indicative of a bullish or bearish trend.
What Is Bollinger Bands Crossover Study?
Bollinger bands crossover is a technical study that shows price breakouts from bollinger bands.
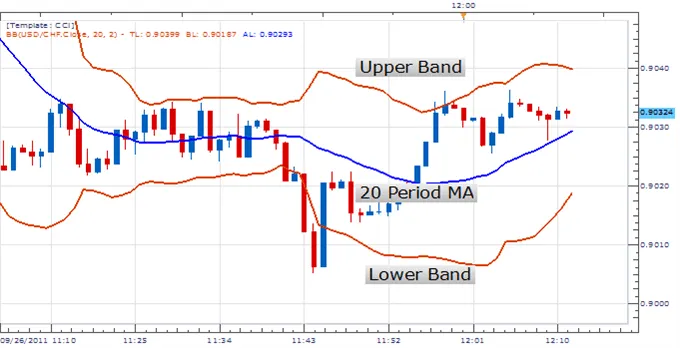
Bollinger bands are typically two standard deviations from the moving average. This means that 95% of all price movement for a security will fall between the bollinger bands.
A crossover outside of the bollinger bands is highly indicative of a bullish or bearish crossover.
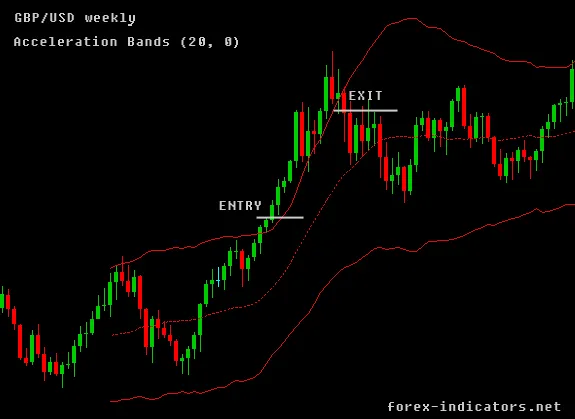
If the price of a security rises above the upper bollinger band, this would indicate a bullish crossover. The security is on a very strong upward trend. Investors may consider the security overbought once it crosses above the upper band. Accordingly, a crossover of price back below the upper band would indicate the security has moved from its overbought conditions.
If the price of a security crosses below the lower bollinger band, this indicates a bearish crossover. The security is on a very strong downward trend. Similarly, investors may consider the security oversold after it crosses below the lower bollinger band. As the price moves back to its place above the lower bollinger band, the security has moved from its oversold conditions.
Summary
- Crossover of price outside of bollinger bands is highly indicative of a bullish or bearish trend.
- A crossover above the upper bollinger band indicates a strong upward trend.
- A crossover below the lower bollinger band indicates a strong downward trend.
- A moving average strategy is used in conjunction with bollinger bands. Investors may choose between a simple, exponential, weighted, Wilder’s, or Hull moving average.
Bollinger Bands Crossover is just one of many studies that Archaide automates. For a full list of strategies and studies available click here.
Like what you read? Check out the rest of our content!
