Wilder's Smoothing (Wilder's) Study
By Timothy Yslava
TL;DR:
The Wilder's Smoothing (Wilders) is a type of moving average that assigns weights to price data (similar to Exponential Moving Average) which indicates trends that could be used as a trading indicator for a given security.
What Is the Simple Moving Average?
The Wilders Moving Average is lagging technical indicator in the moving average family that helps you identify price trends for a given security.
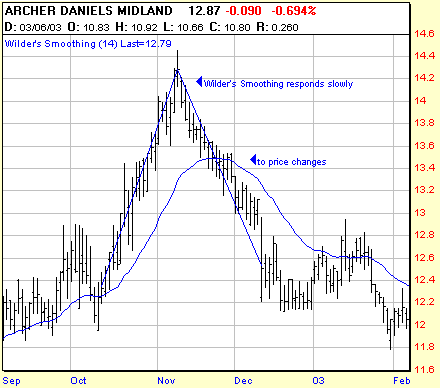
Source: traderslog.com (2022)
Figure 1: Wilder’s Smoothing
Wilder's Smoothing is similar to the Exponential Moving Average and can be calculated from the EMA.
Compared to the EMA, Wilders MA responds more slowly to price changes, where a Wilder Moving Average of n periods gives similar values to an EMA of (n+1)/2 periods. For example, a 14-period EMA has almost the same values as a 7-period Wilder MA.
Wilder’s Formula
Wilder's (periods)=EMA(periods) + 12
Wilder's(today) = (PriceToday (Smoothing1+Wilder's (periods))) + (EMA Yesterday (1-Smoothing1+Wilder's (periods)))
Where smoothing is a constant (commonly, the common choice is 2). The bigger the smoothing factor, the more recent prices have a greater influence on Wilder’s Smoothing.
Where price is the average stock price over time using the close price, opening price, high price, low price.
And where periods are intervals of time.
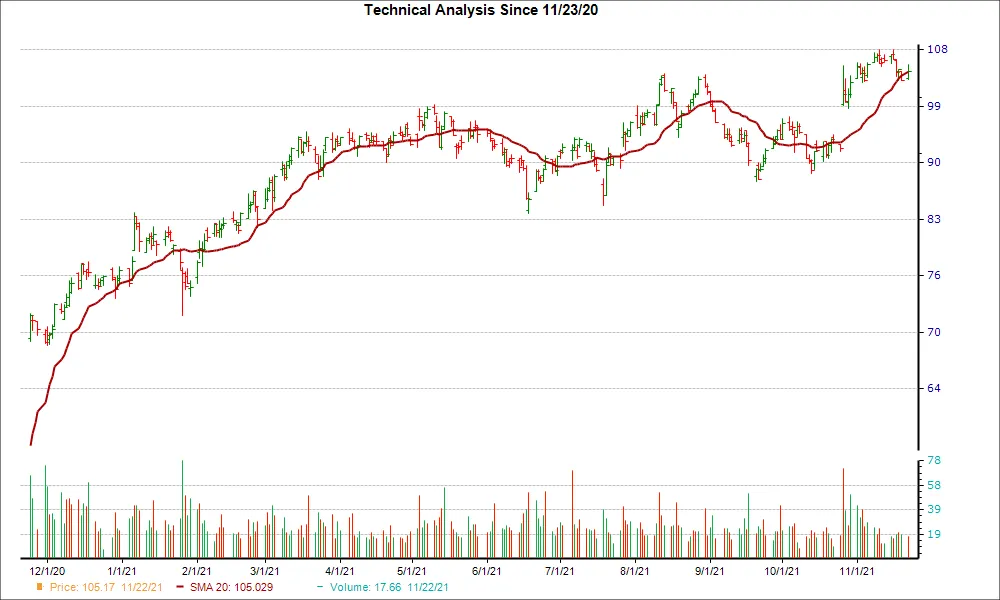
As periods pass, the moving average may slope in a given direction and therein indicate a trend. The steepness of the slope could indicate the trend’s strength.
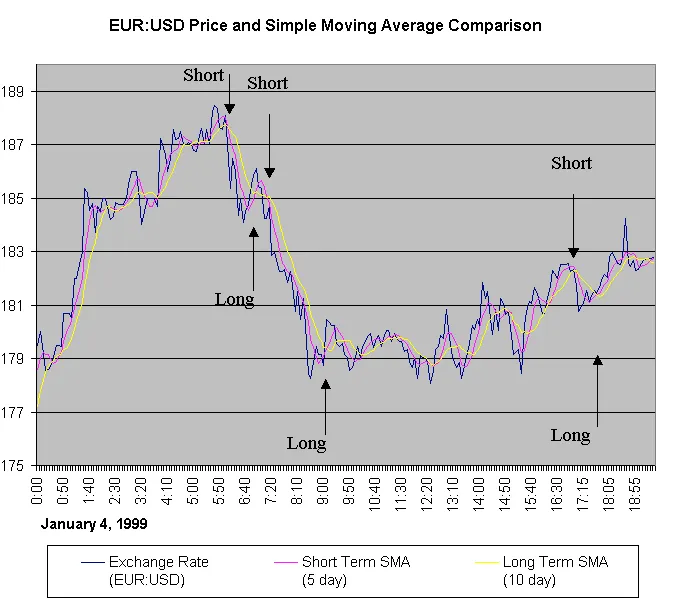
A popular analysis technique that is used with moving averages is looking for price breakouts: crossovers of the price plot with the moving average. Bullish breakouts are indicated every time the price crosses above the average. When the price falls below the average, a bearish breakout is recognized.
How do you use the simple moving average?
7, 14, 26, and 52 days are the most common for identifying support and resistance levels and overall trends using Wilder's Smoothing Moving Average Strategy.
When do you buy and sell with Wilder's Smoothing strategy?
With moving averages, you’ll buy and sell as the moving average crosses price. There are two methods for trading with this strategy: trend following and reversal.
Common entry points:
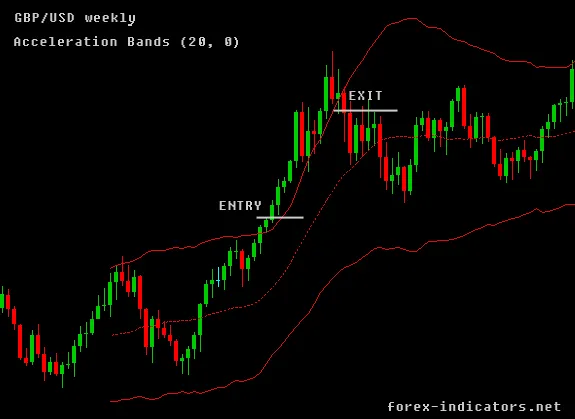
- When a security’s price rises above the Wilder’s
- When a security’s price falls and bounces off of the Wilder’s
Common exit points:
- When a security’s price falls below the Wilder’s
- When a security’s price rises bounces off of the Wilder’s
Summary
- Wilder’s Smoothing Moving Average are one of the most commonly used technical indicators.
- Wilder’s Smoothing Moving Average is a weighted moving average strategy. It places greater weight on a security’s more recent prices, allowing it to respond more quickly to trend changes.
- Wilder’s Smoothing Moving Average is a weighted moving average strategy. It places greater weight on a security’s more recent prices, allowing it to respond more quickly to trend changes.
- Wilder’s Smoothing Moving Average, like all moving average strategies, is a lagging indicator. This means they are not necessarily predictive of future prices, they simply highlight the trend that is being followed by the stock price.
- Wilder’s Smoothing Moving Average buy and sell indicators can be set by trend following or reversal. Trend following is more commonly used.
The Wilder’s Smoothing Moving Average is just one of many strategy that Archaide automates. For a full list of strategies and studies available click here.
Like what you read? Check out the rest of our content!

