Moving Average Difference (MAD) Study
By Samantha Baltodano
What Is The Moving Average Difference Study?
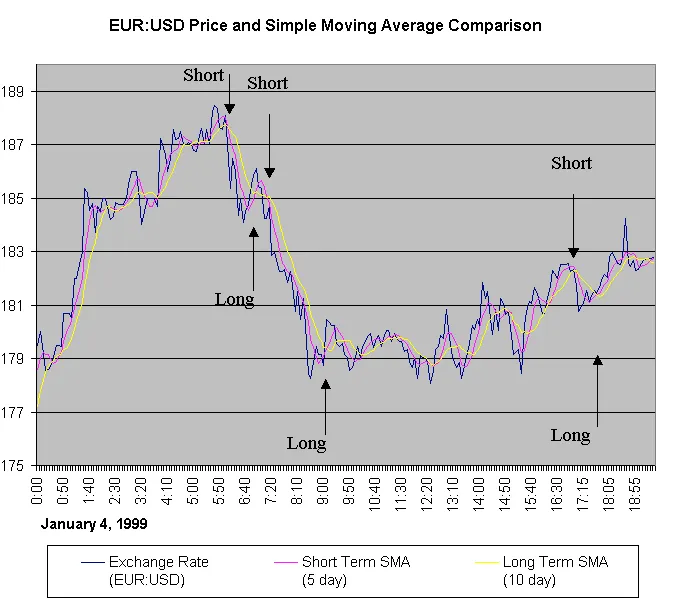
The MAD (Moving Average Difference) study is a trend-following oscillator based on the difference between two simple moving averages of price: a faster and a slower one.
The lengths of the moving averages need to be selected so that the length of the slower average is greater than that of the faster one by half-length of the dominant market cycle.
The difference between the averages is calculated as a percentage of the slower one.
–
Note that the MAD indicator is basically the same as the Moving Average Crossover (MAC) indicator, just interpreted differently.
It is also similar to the Moving Average Convergence-Divergence (MACD) indicator, which uses the difference between two exponential smoothing filters with different smoothing constants instead of two moving averages.
Test The Moving Average Difference Study
Great news!
You can back test this exact strategy on historical data for any of your favorite symbols using TradingView.
This strategy has already been built and all you have to do is log in and take it for a spin. You can access this indicator here.
If you’re new to back testing and to TradingView, don’t worry. I created a step-by-step guide you can follow to begin testing the Moving Average Difference Study.
Moving Average Difference is just one of many studies that Archaide automates. For a full list of strategies and studies available click here.
Like what you read? Check out the rest of our content!


